Amir NejadinQuantJamIntroduction to Financial Portfolios — Risk & Return with PythonThis articles demonstrates how to measure the risk adjusted performance of financial portfolios6 min read·Mar 9, 2021----
Amir NejadinQuantJamIntroduction to Financial Portfolios— Correlation & Diversification with PythonThis articles demonstrates how to measure the correlation of financial portfolios to build diversified portfolios.6 min read·Feb 9, 2021----
Amir NejadinTowards Data ScienceConvolutional Neural Network Champions — Part 3: VGGNet (TensorFlow 2.x)Part 3 of this multiple-part series on the most popular convolutional neural network (CNN) architectures with reproducible Python notebooks7 min read·Jan 18, 2021----
Amir NejadinQuantJamIntroduction to Time Series — Trend Decomposition with PythonMultipart series on time series analysis with Python applied to financial datasets6 min read·Nov 2, 2020----
Amir NejadinTowards Data ScienceConvolutional Neural Network Champions — Part 2: AlexNet (TensorFlow 2.x)Part 2 of the multiple-part series on the most popular convolutional neural network (CNN) architectures with reproducible Python notebooks.9 min read·Oct 5, 2020----
Amir NejadinTowards Data ScienceConvolutional Neural Network Champions —Part 1: LeNet-5The multiple-part series on the most popular convolutional neural network (CNN) architectures with reproducible Python notebooks.17 min read·Jun 1, 2020----
Amir NejadinQuantJamHow to Create Stock Alert System using Python and Windows Task SchedulerThere are a plethora of stock alert systems available for free or for a nominal price. However, I found most of these alert system too…6 min read·May 2, 2020----
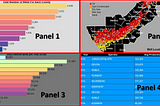
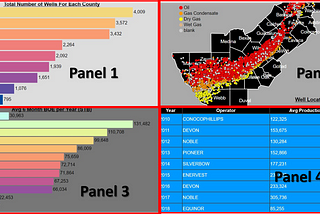
Amir NejadBuilding A Dashboard D3.JS & JavaScript: Upstream Oil & Gas Data (Part 2 of 2)In the first part of this article (Link) we overview terminologies of upstream data, and data required to build this case study. In this…7 min read·Dec 13, 2018----
Amir NejadBuilding A Dashboard D3.JS & JavaScript: Upstream Oil & Gas Data (Part 1 of 2)In this tutorial I am going to show you how to build a dashboard with JavaScripts and D3.js to visualize upstream oil and gas data. But…5 min read·Dec 13, 2018--1--1
Amir NejadinQuantJamExploring Stock Market Seasonality Trends with Python8 min read·Sep 16, 2018--1--1